

Ethereum: Price Review and Scenarios for the Coming Week Market conditions
as of October 18, 2026.
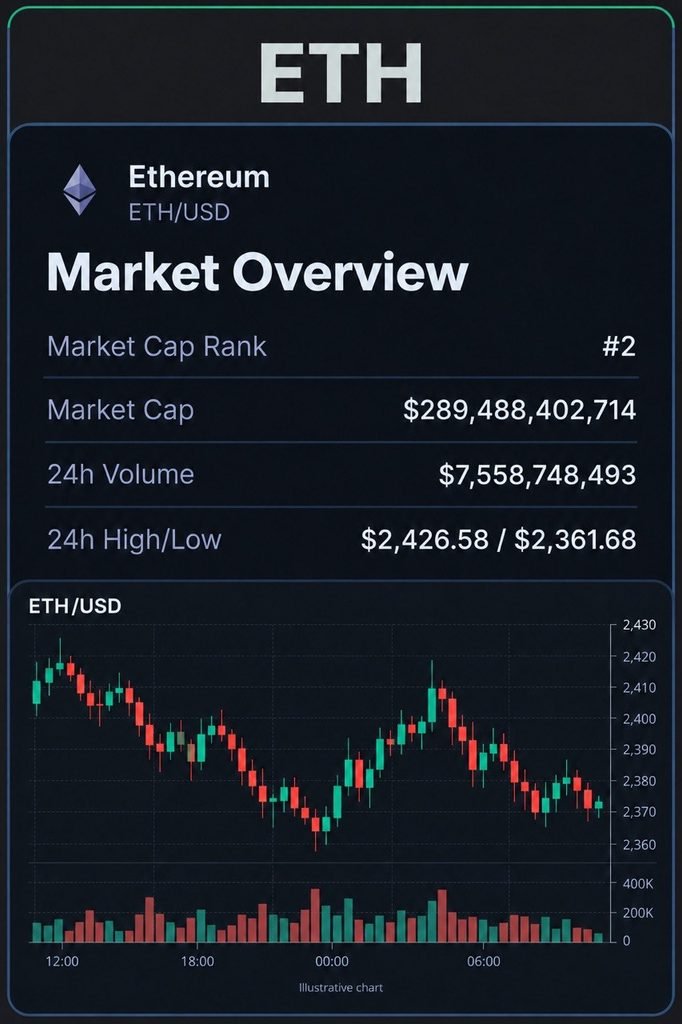
Ethereum heads into the October 19–25 week under selling pressure. At the time of writing, ETH is trading at approximately $2,368, down around 1.53% from the previous close, with an intraday range of roughly $2,362–$2,427. These prices represent a snapshot and will change after publication. A TradingKey report published today also noted that Ethereum had fallen approximately 6% over seven days.
The market is therefore entering the coming week after a significant decline, and any rebound will need to be distinguished from a sustained recovery. Demand through ETFs. One confirmed reason for caution is the outflow of money from U.S. Ethereum exchange-traded funds. According to Farside Investors, these funds recorded $320.1 million in combined net outflows during October 12–16.
Tuesday was the only session with a net inflow, totaling $24.8 million; the other four trading sessions recorded net outflows. ETHA accounted for approximately $299 million in net withdrawals over the week. These figures reflect flows into and out of a particular group of investment products, rather than total global demand for ETH. Nevertheless, they do not yet provide evidence of a sustained return of buyers through this channel.
Understanding the price reference points. The scenarios below use the round-number levels of $2,300, $2,400, and $2,500, together with the boundaries of the observed intraday range. These round numbers are convenient reference points for comparing scenarios, rather than support and resistance levels established through a comprehensive historical chart analysis. Their significance cannot be confirmed without further analysis of trading volumes and repeated price reactions. From the current price, a move to $2,400 would represent a gain of approximately 1.4%, while reaching $2,500 would mean an increase of around 5.6%. A decline to $2,300 would amount to roughly 2.9%.
These calculations illustrate the size of potential moves, rather than their likelihood. Recovery scenario. I would consider a move back above $2,400, followed by the ability to hold above that level, an initial sign of improvement. A break above approximately $2,427, the upper boundary of the current intraday range, would provide more meaningful confirmation. In that case, $2,500 could become the next round-number reference point to watch. However, a brief move above a level followed by an immediate reversal would not demonstrate sustained demand. A stronger recovery scenario would ideally involve several conditions: the price holding its gains, increased buying volume in the spot market, and improving ETF flows. These are conditions for the proposed scenario, rather than developments that have already been confirmed. If ETH subsequently falls back below $2,400 and starts making new lows, the case for recovery would weaken.
Sideways scenario. A second possibility is trading without a sustained direction, within an illustrative range of $2,300–$2,450. This range is a working framework around the current price, rather than a confirmed forecast of the week’s boundaries. In this scenario, rallies would encounter selling, while declines would fail to develop into a sustained downward move. The key question would be where the price spends more time: near the upper end of the range or close to its lower boundary. Gradually rising lows would improve the picture, whereas repeated failed recovery attempts would warrant greater caution.
Trading within a range does not, by itself, establish that large investors are accumulating ETH or that a rally is approaching; those conclusions require additional evidence. Further downside scenario. The bearish scenario involves a break below the current intraday low of approximately $2,362, without a quick recovery. Attention would then shift to the round-number level of $2,300. If the price falls below it and remains there, $2,250 can serve as an illustrative next downside reference point, approximately 5% below the starting price. This is a hypothetical risk marker, rather than a confirmed area where buyers will necessarily step in. Continued ETF outflows, weakness in Bitcoin, and insufficient demand during rebound attempts could reinforce this scenario. A quick recovery above lost levels, followed by the ability to hold them, would weaken it.
What to watch during October 19–25. The first priority is the daily Ethereum ETF flow data: will withdrawals continue, or will several positive sessions emerge? A single day of inflows would not establish a new trend, particularly after a negative weekly total. The second reference point is ETH’s performance relative to Bitcoin. If Ethereum rises in dollar terms while ETH/BTC continues falling, ETH would still be underperforming BTC. The third factor is expectations ahead of the next Federal Reserve meeting. According to the official calendar, it is scheduled for October 27–28, after the week covered in this review. It would therefore be incorrect to present the Fed’s decision as an October 19–25 event, although shifting expectations ahead of the meeting could influence market behavior.
How to assess forecasts. Ethereum’s price next Sunday cannot be predicted with certainty. This review does not assign probabilities to the scenarios or use a statistical forecasting model, so allocating numerical odds to a rally, sideways trading, or further declines would be unjustified. The practical purpose of scenario analysis is to identify in advance which observations would support or weaken each possibility. For a recovery, those observations include a move back above $2,400 and a break above the current intraday high. For continued weakness, they include a new low and an inability to reclaim lost levels.
Assessment for the coming week. My interpretation of the verified data is that Ethereum still warrants caution: the recent price decline has coincided with negative weekly ETF flows. That does not rule out a rebound. The main question for the coming week is whether any rebound develops into a sustained recovery or remains a temporary move within a broader decline. The prices discussed here are reference points for conditional scenarios, rather than promises of returns or personalized recommendations to buy or sell ETH.
Leave a Reply